[1] "20260715_r13_GR_pos-dil-series"
[1] "20260715_r5_GR_pos-dil-series"
[1] "20260715_r7_GR_pos-dil-series"
[1] "20260824_r5_GR_substrate-dil-series"Substrate Dilution Series
Purpose
The \(V_{max}\) of our prion seed can be determined by performing a dilution series of the substrate. The rate of the reaction should reach some asymptote as the substrate concentration increases. This experiment will hopefully determine that asymptote for a range of substrate concentrations.
Design
- Positive seed sample: 141234
- Seed dilution factor: 10-3
- Temperature: 42°C
- Shaking speed: 700rpm
- Shaking time: 60s
- Resting time: 60s
- Read cycle time: 15min
- Reaction time: 96 hr
- Substrate: HaPrP(90-231)
- Substrate concentrations: 0.01 \(\rightarrow\) 0.4ug/uL
Volumes and Concentrations
| Substrate Conc (ug/ul) | Substrate Vol (uL) | Water (uL) |
|---|---|---|
| 0.010 | 0.010 | 0.010 |
| 0.027 | 0.027 | 0.027 |
| 0.044 | 0.044 | 0.044 |
| 0.061 | 0.061 | 0.061 |
| 0.078 | 0.078 | 0.078 |
| 0.095 | 0.095 | 0.095 |
| 0.110 | 0.110 | 0.110 |
| 0.130 | 0.130 | 0.130 |
| 0.150 | 0.150 | 0.150 |
| 0.160 | 0.160 | 0.160 |
| 0.180 | 0.180 | 0.180 |
| 0.200 | 0.200 | 0.200 |
| 0.210 | 0.210 | 0.210 |
| 0.230 | 0.230 | 0.230 |
| 0.250 | 0.250 | 0.250 |
| 0.260 | 0.260 | 0.260 |
| 0.280 | 0.280 | 0.280 |
| 0.300 | 0.300 | 0.300 |
| 0.320 | 0.320 | 0.320 |
| 0.330 | 0.330 | 0.330 |
| 0.350 | 0.350 | 0.350 |
| 0.370 | 0.370 | 0.370 |
| 0.380 | 0.380 | 0.380 |
| 0.400 | 0.400 | 0.400 |
Plate Layout of Substrate Concentrations (ug/uL)
| 1 | 2 | 3 | 4 | 5 | 6 | 7 | 8 | 9 | 10 | 11 | 12 | |
|---|---|---|---|---|---|---|---|---|---|---|---|---|
| A | 0.010 | 0.044 | 0.078 | 0.110 | 0.150 | 0.180 | 0.210 | 0.250 | 0.280 | 0.320 | 0.350 | 0.380 |
| B | | | | | | | | | | | | | | | | | | | | | | | | |
| C | | | | | | | | | | | | | | | | | | | | | | | | |
| D | \(\vee\) | \(\vee\) | \(\vee\) | \(\vee\) | \(\vee\) | \(\vee\) | \(\vee\) | \(\vee\) | \(\vee\) | \(\vee\) | \(\vee\) | \(\vee\) |
| E | 0.027 | 0.061 | 0.095 | 0.130 | 0.160 | 0.200 | 0.230 | 0.260 | 0.300 | 0.330 | 0.370 | 0.400 |
| F | | | | | | | | | | | | | | | | | | | | | | | | |
| G | | | | | | | | | | | | | | | | | | | | | | | | |
| H | \(\vee\) | \(\vee\) | \(\vee\) | \(\vee\) | \(\vee\) | \(\vee\) | \(\vee\) | \(\vee\) | \(\vee\) | \(\vee\) | \(\vee\) | \(\vee\) |
Results
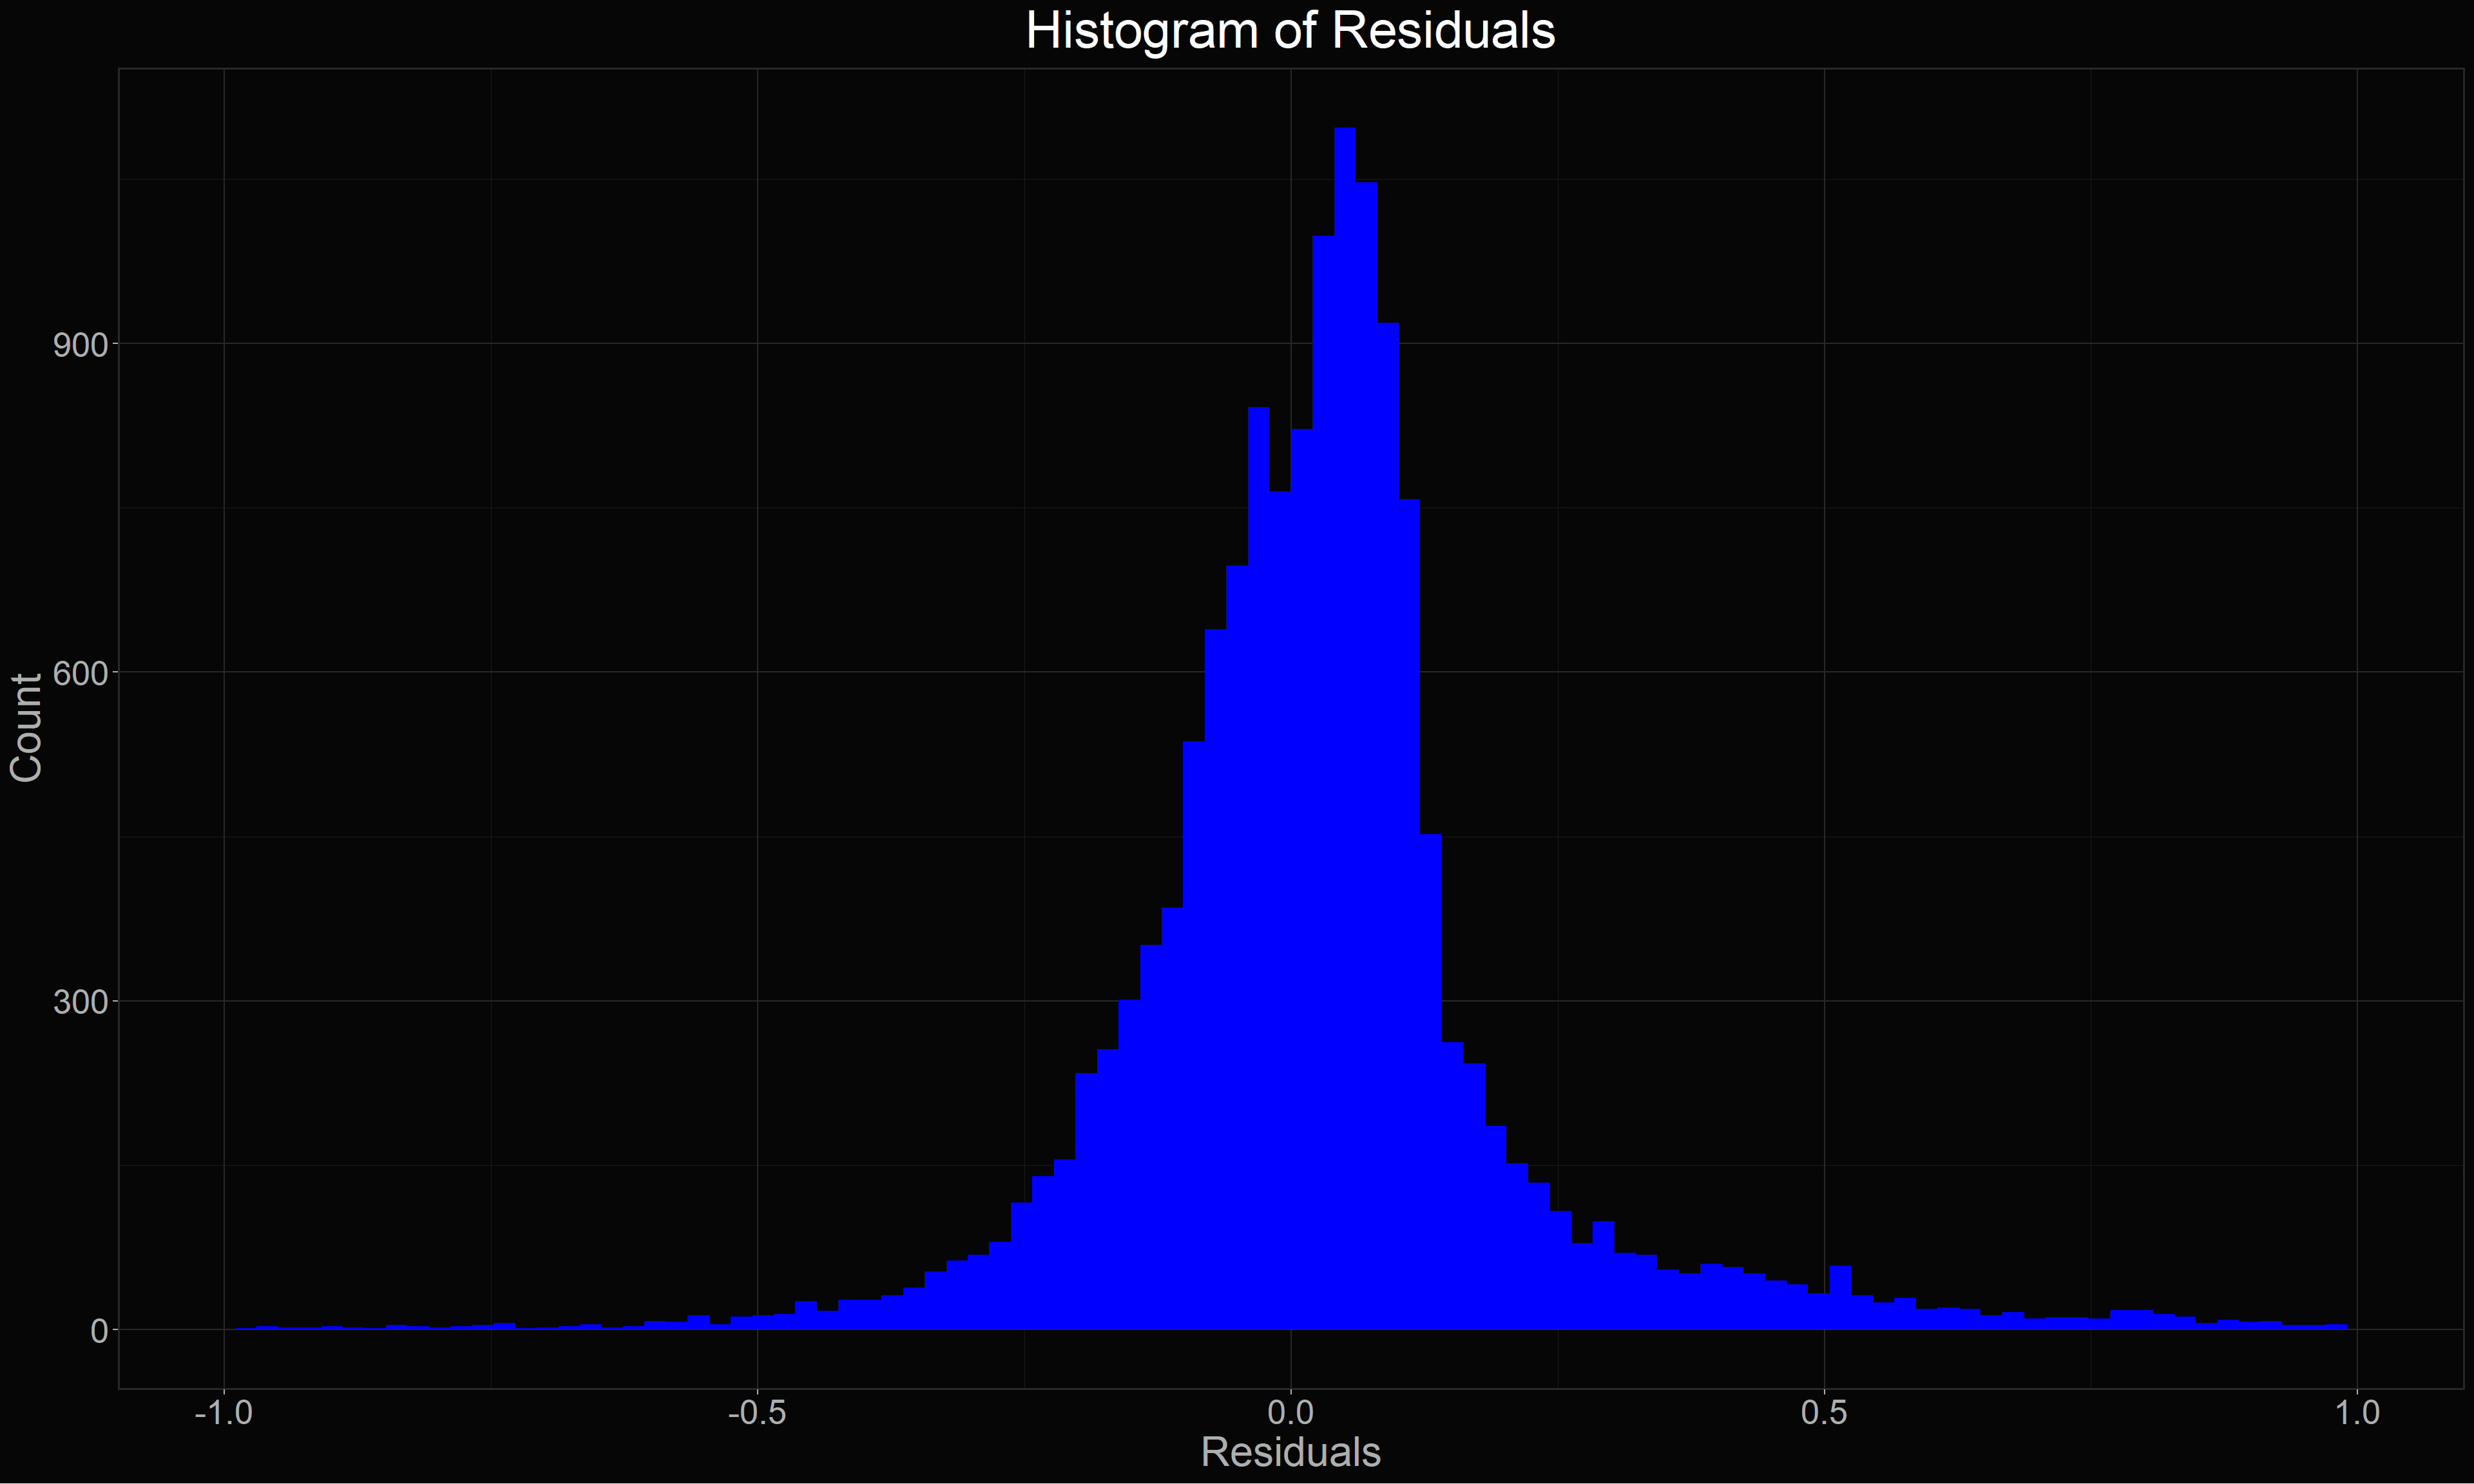
Residuals
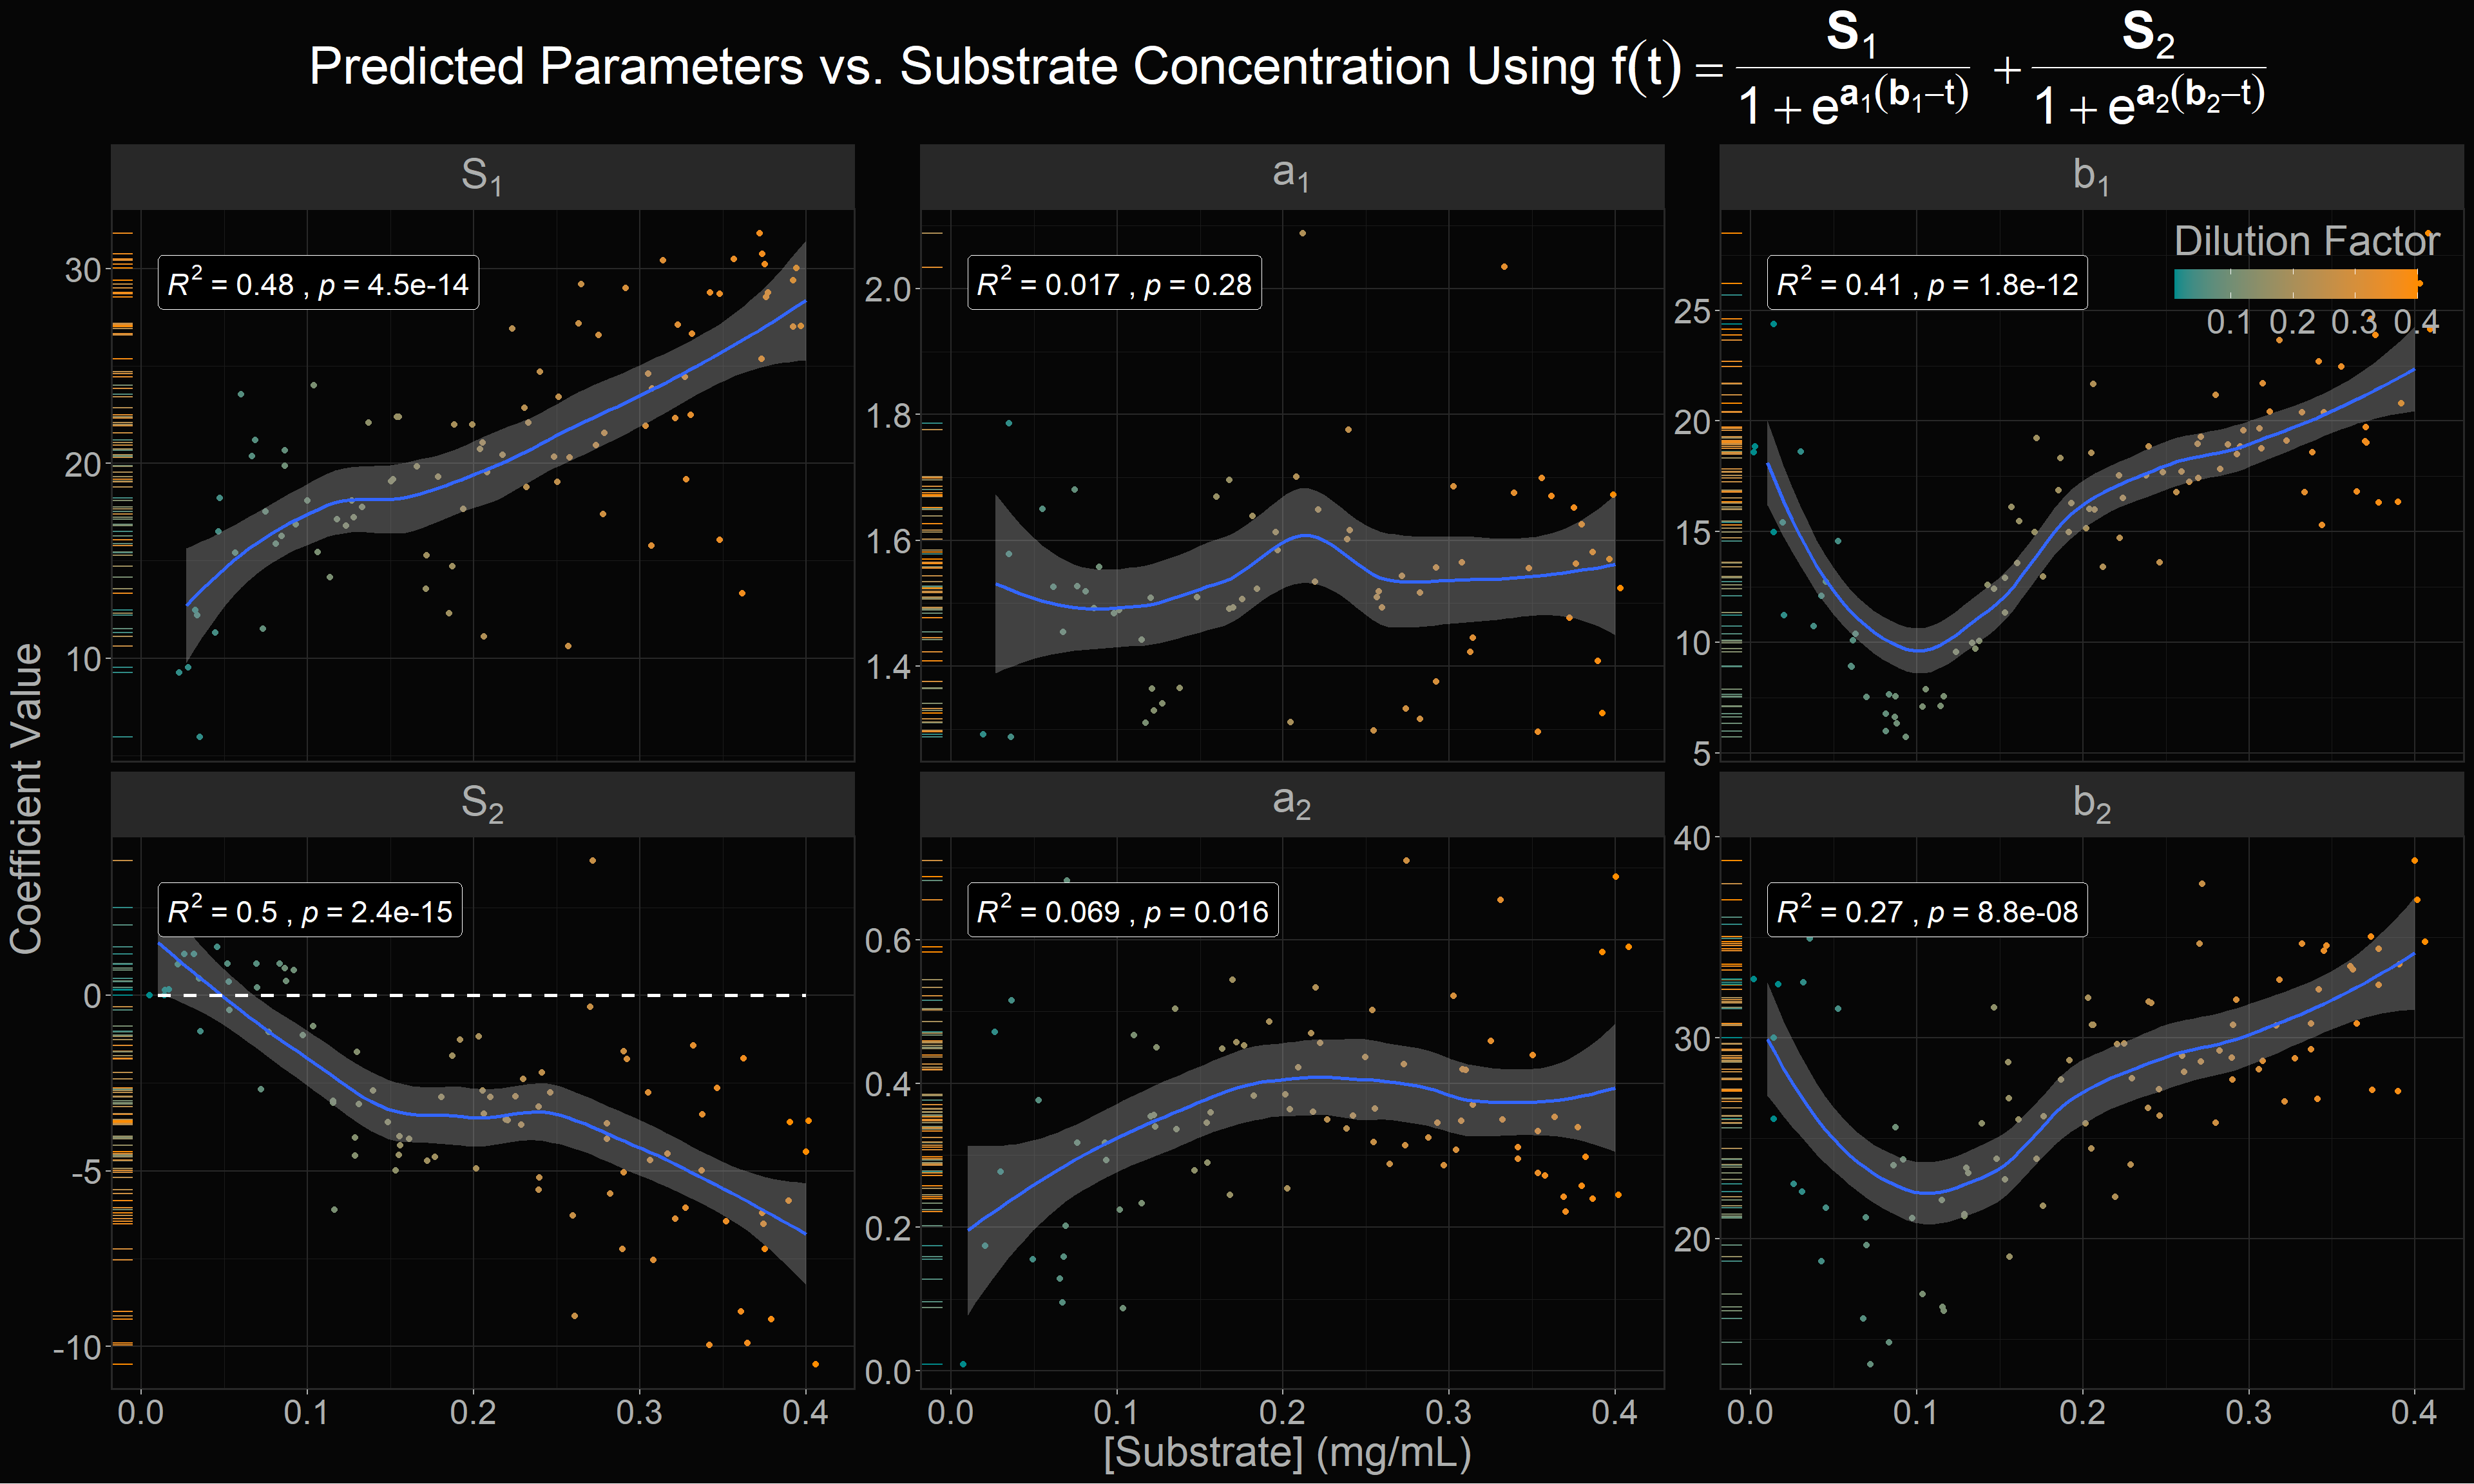
Effect of substrate concentration on model coefficients
S1,2
The model asymptotes have both a positive and negative relationship with the substrate concentration ([S]) for S1 and S2, respectively. The positive relationship with S1 is expected given that there is more substrate incorporated into fibrils which would directly result in a higher fluorescent signal.
The negative relationship with S2 is interesting. This indicates that the dampening effect increases with [S]. Previously, we observed that the dampening effect had a negative relationship with the rate of the reaction. However, this isn’t necessarily the case here because the rate increased only to a point, then decreased as [S] increased.
a1,2
The apparent rate constant (a1) stayed more or less constant through every [S]. I may be wrong, but I believe this is showing the rate constant of our specific seed (141234).
The secondary rate constant (a2) had an initial positive relationship with [S], but reached an equilibrium around 0.2 mg/mL. These low initial values could be explained by S2 being near zero, and thus their values could be meaningless, and once an accurate S2 was established, the a2 values resolved around the true a2 value.
b1,2
The lag time (b1) behaved as expected up to 0.1 mg/mL [S], at which point it peaked around 20 h and then decreased to an equilibrium around 30 h. The peak effect is unexpected if we are framing this in terms of enzyme kinetics. We would expect a smooth curve approaching \(1/V_{max}\), but clearly there is an optimal [S] for this reaction.
The same effect was observed for b2, but this is expected since generally b2 will only be modeled around the same time as b1.
Reaction rate vs. substrate concentration
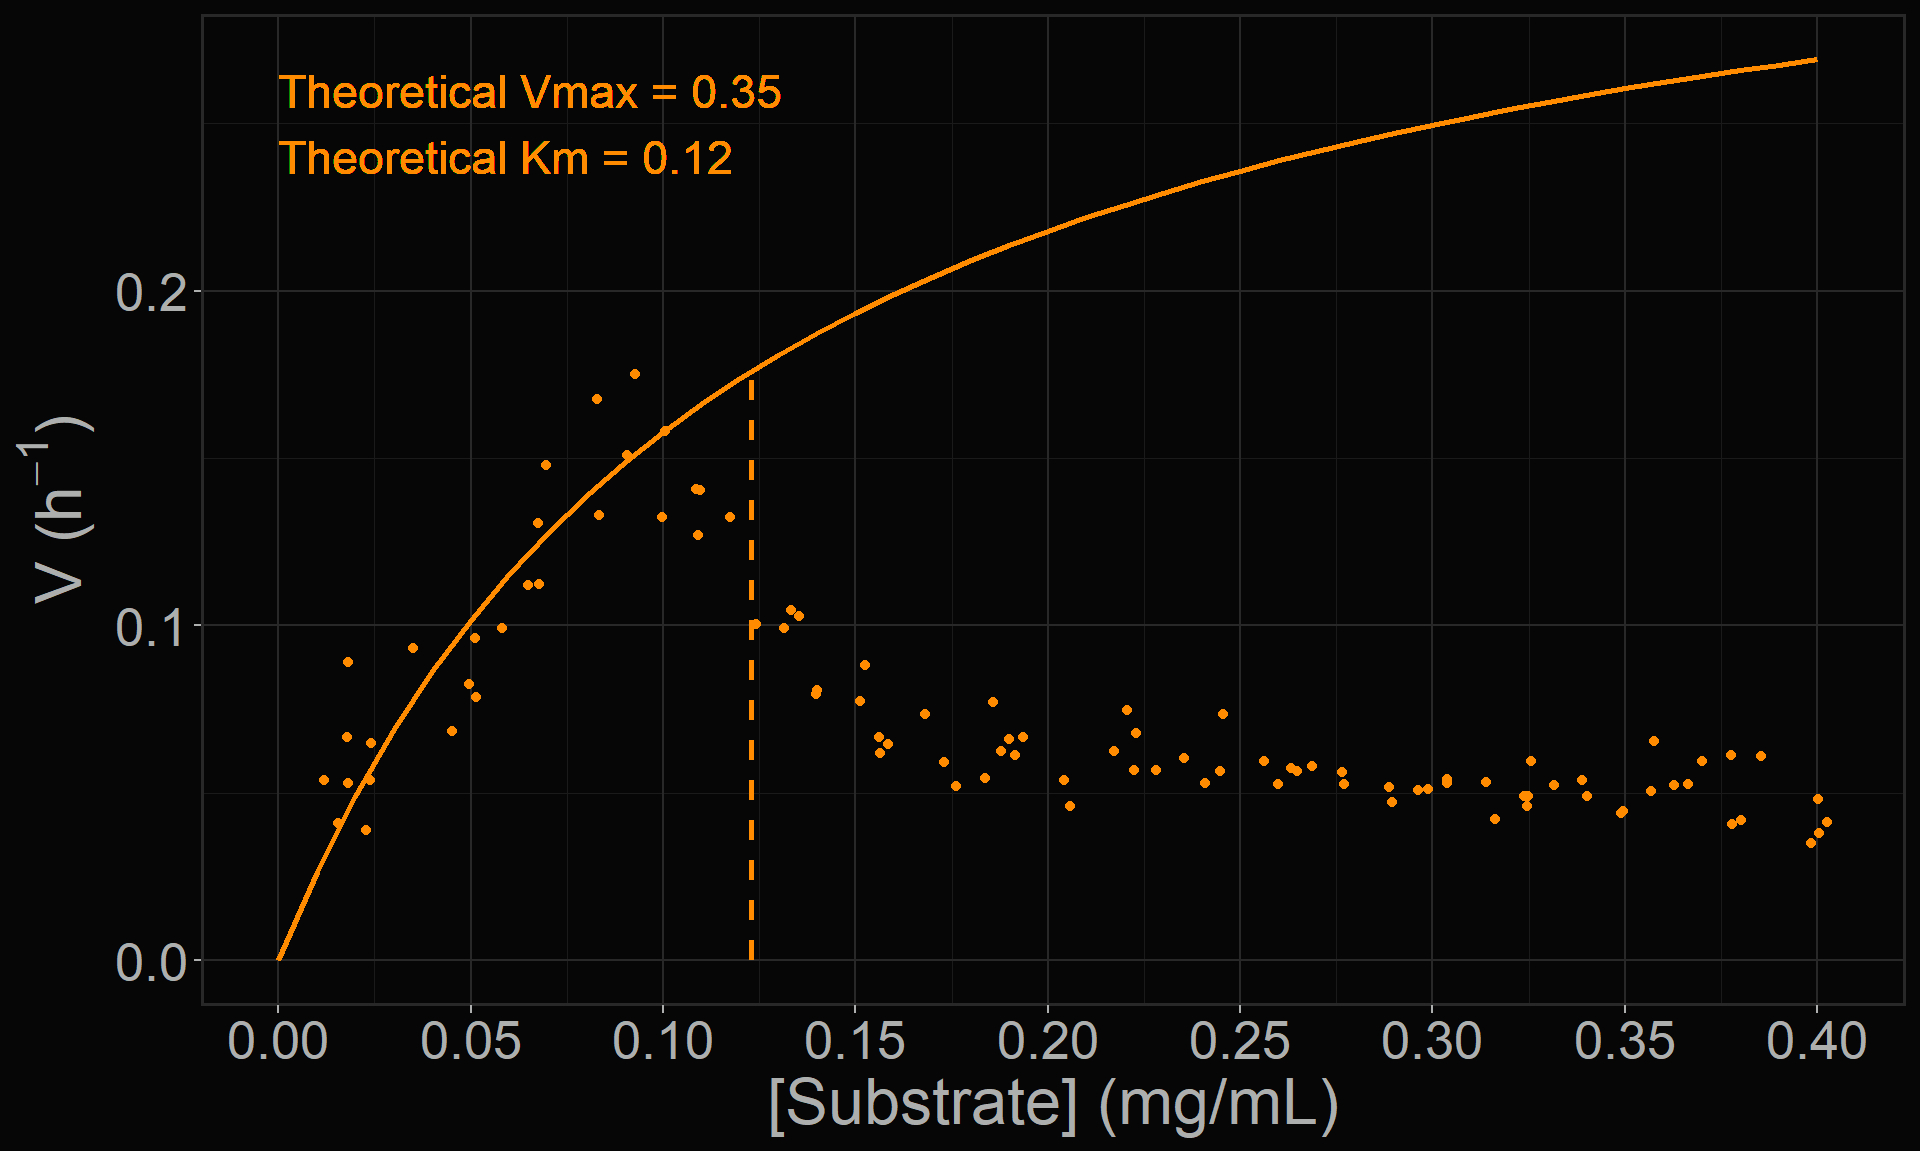
Reaction velocity (V) was roughly calculated as the inverse of the b1 coefficient. These values were plotted against the substrate concentration and a non-linear regression was fitted to the data up to the peak [S] mentioned above. This gave us a theoretical Vmax of 0.35 h-1 and a theoretical Km of 0.12 mg/mL.