[1] "20260715_r13_GR_pos-dil-series"
[1] "20260715_r5_GR_pos-dil-series"
[1] "20260715_r7_GR_pos-dil-series"
[1] "20260824_r5_GR_substrate-dil-series"Positive Seed Dilution Series
Purpose
In order to determine the effect of seed concentration on the kinetics of RT-QuIC, I performed a series of 10-fold dilutions of a known CWD-positive lymph node sample. After fitting the curves, I should be able to see if any of the coefficients are affected.
Design
- Log\(_{10}\) seed dilution factors:
- -3, -3.26, -3.52, -3.78, -4.04, -4.3, -4.57, -4.83, -5.09, -5.35, -5.61, -5.87, -3.13, -3.39, -3.65, -3.91, -4.17, -4.43, -4.7, -5.22, -5.48, -4.96, -5.74, -6
- Temperature: 42°C
- Shaking speed: 700rpm
- Shaking time: 60s
- Resting time: 60s
- Read cycle time: 15min
- Reaction time: 96 hr
- Substrate: HaPrP(90-231)
- Substrate concentration: 0.1 mg/mL
Results
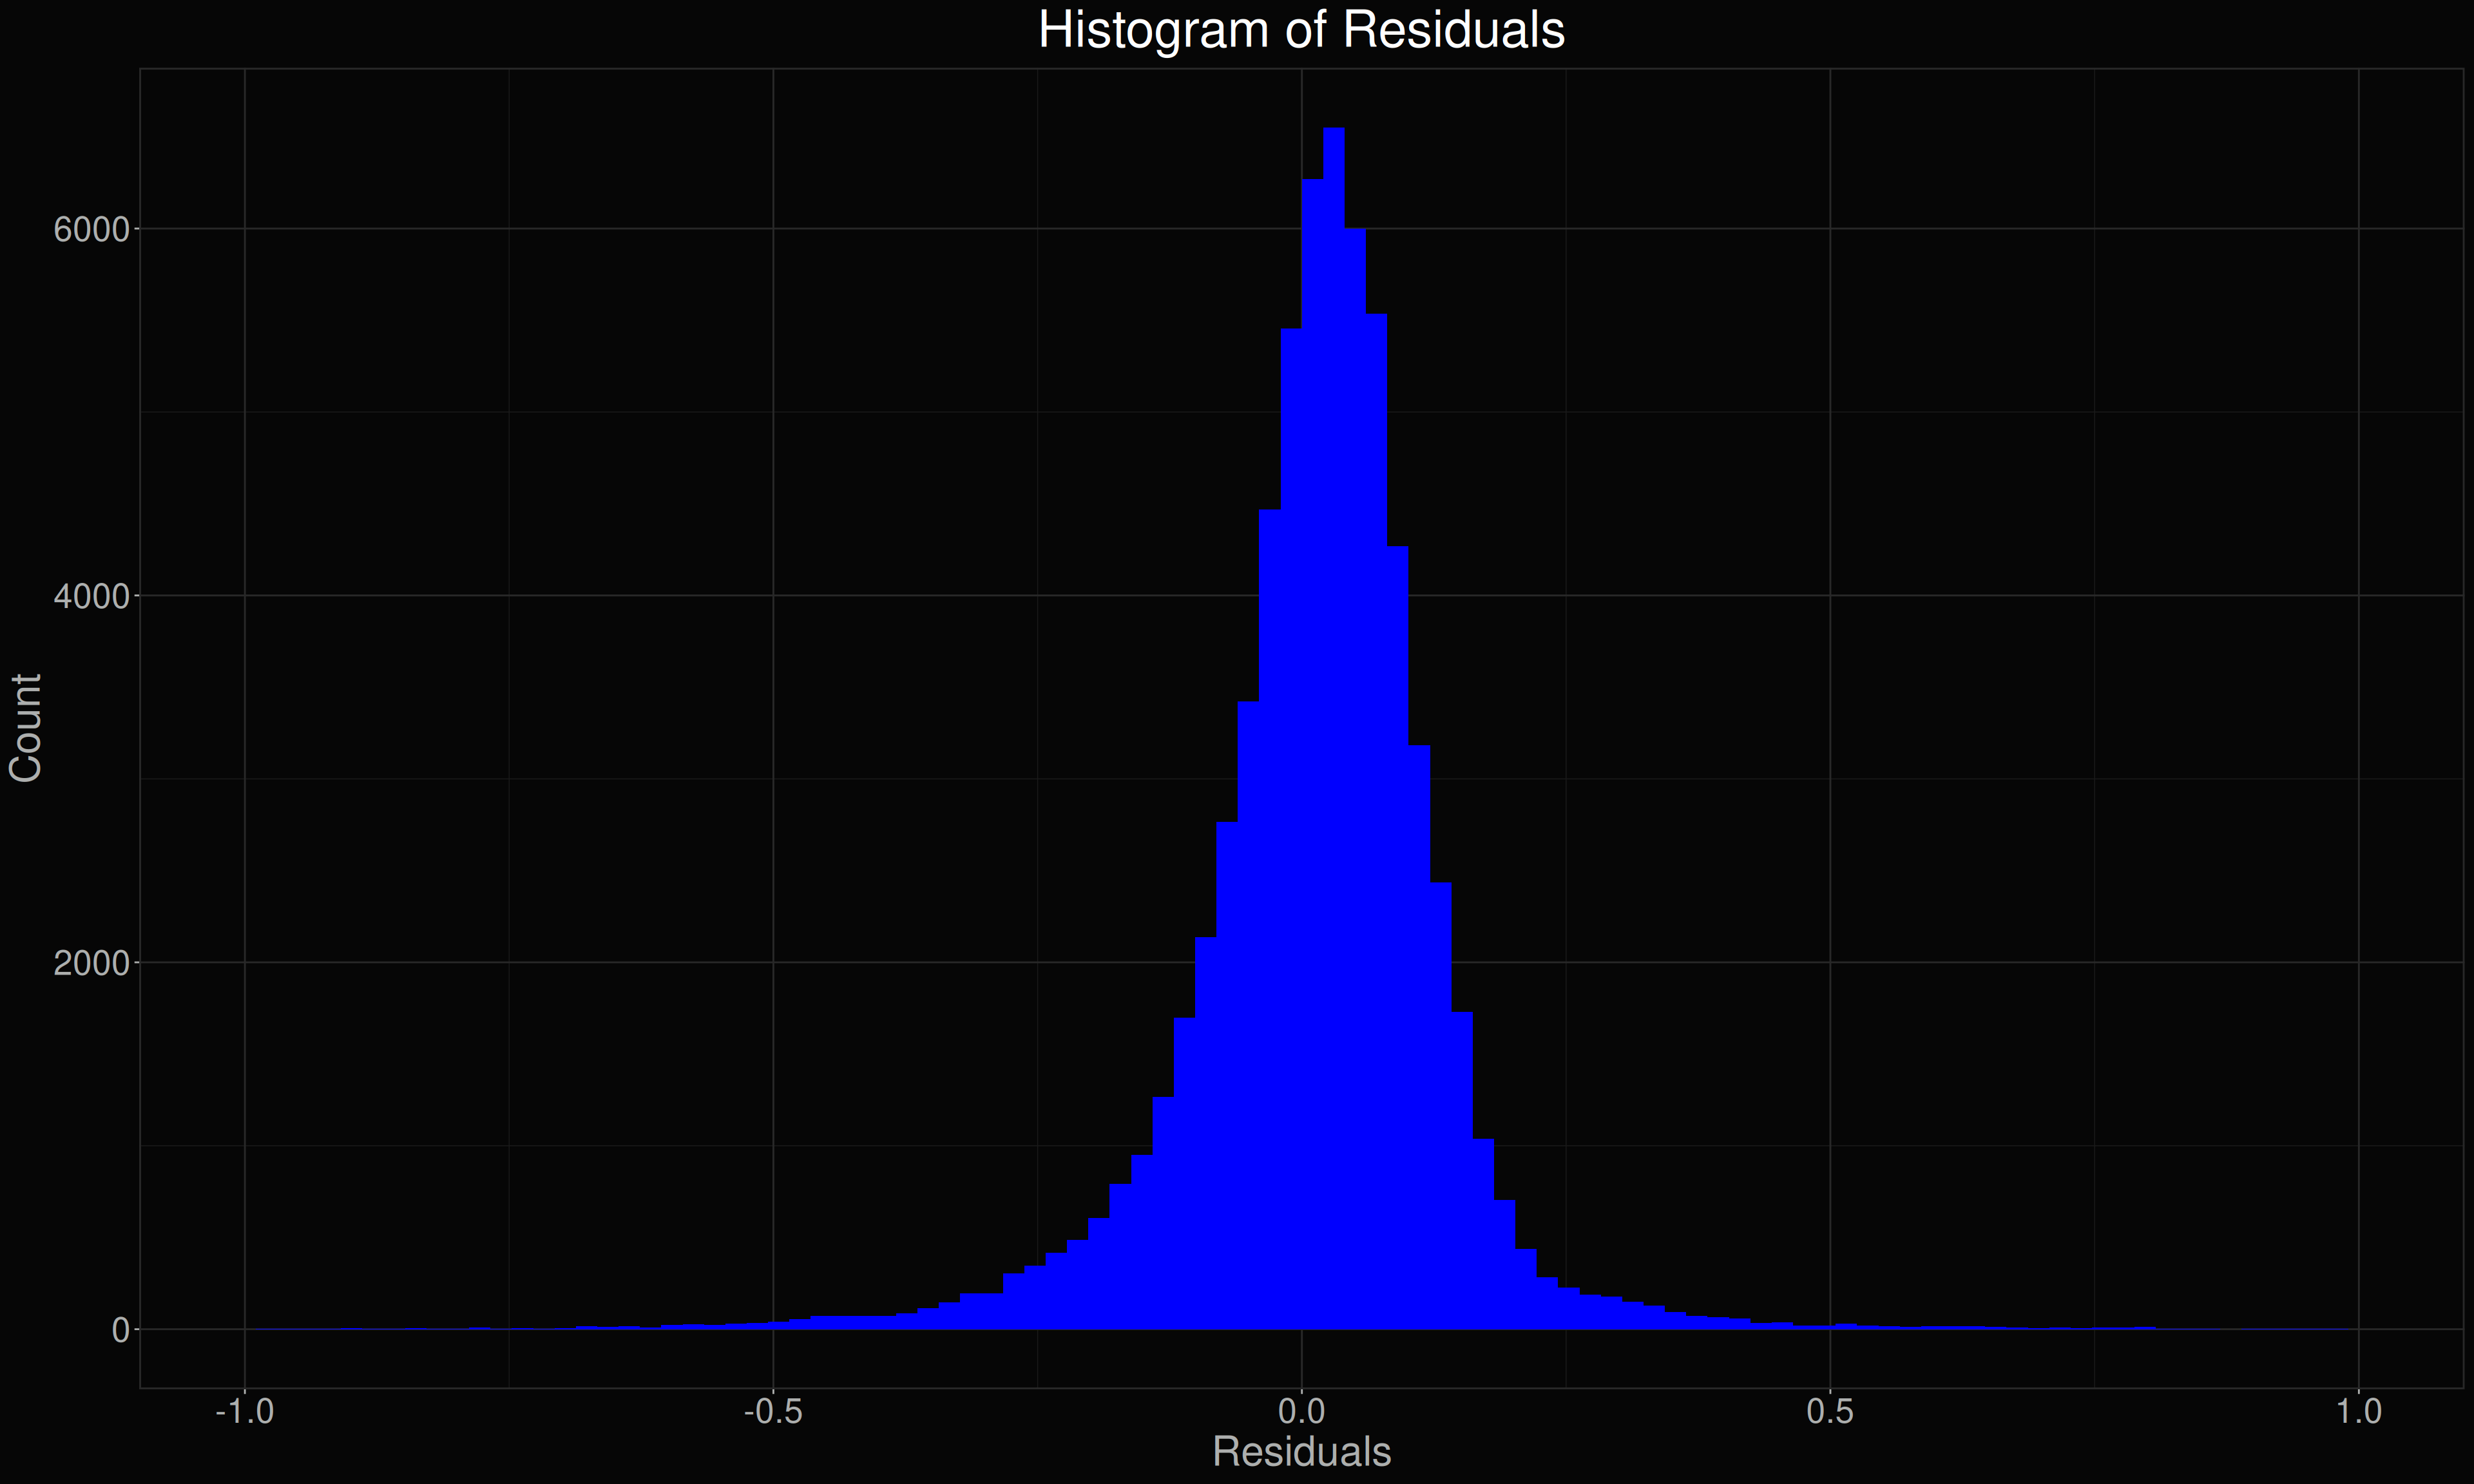
Residuals
Worst fits
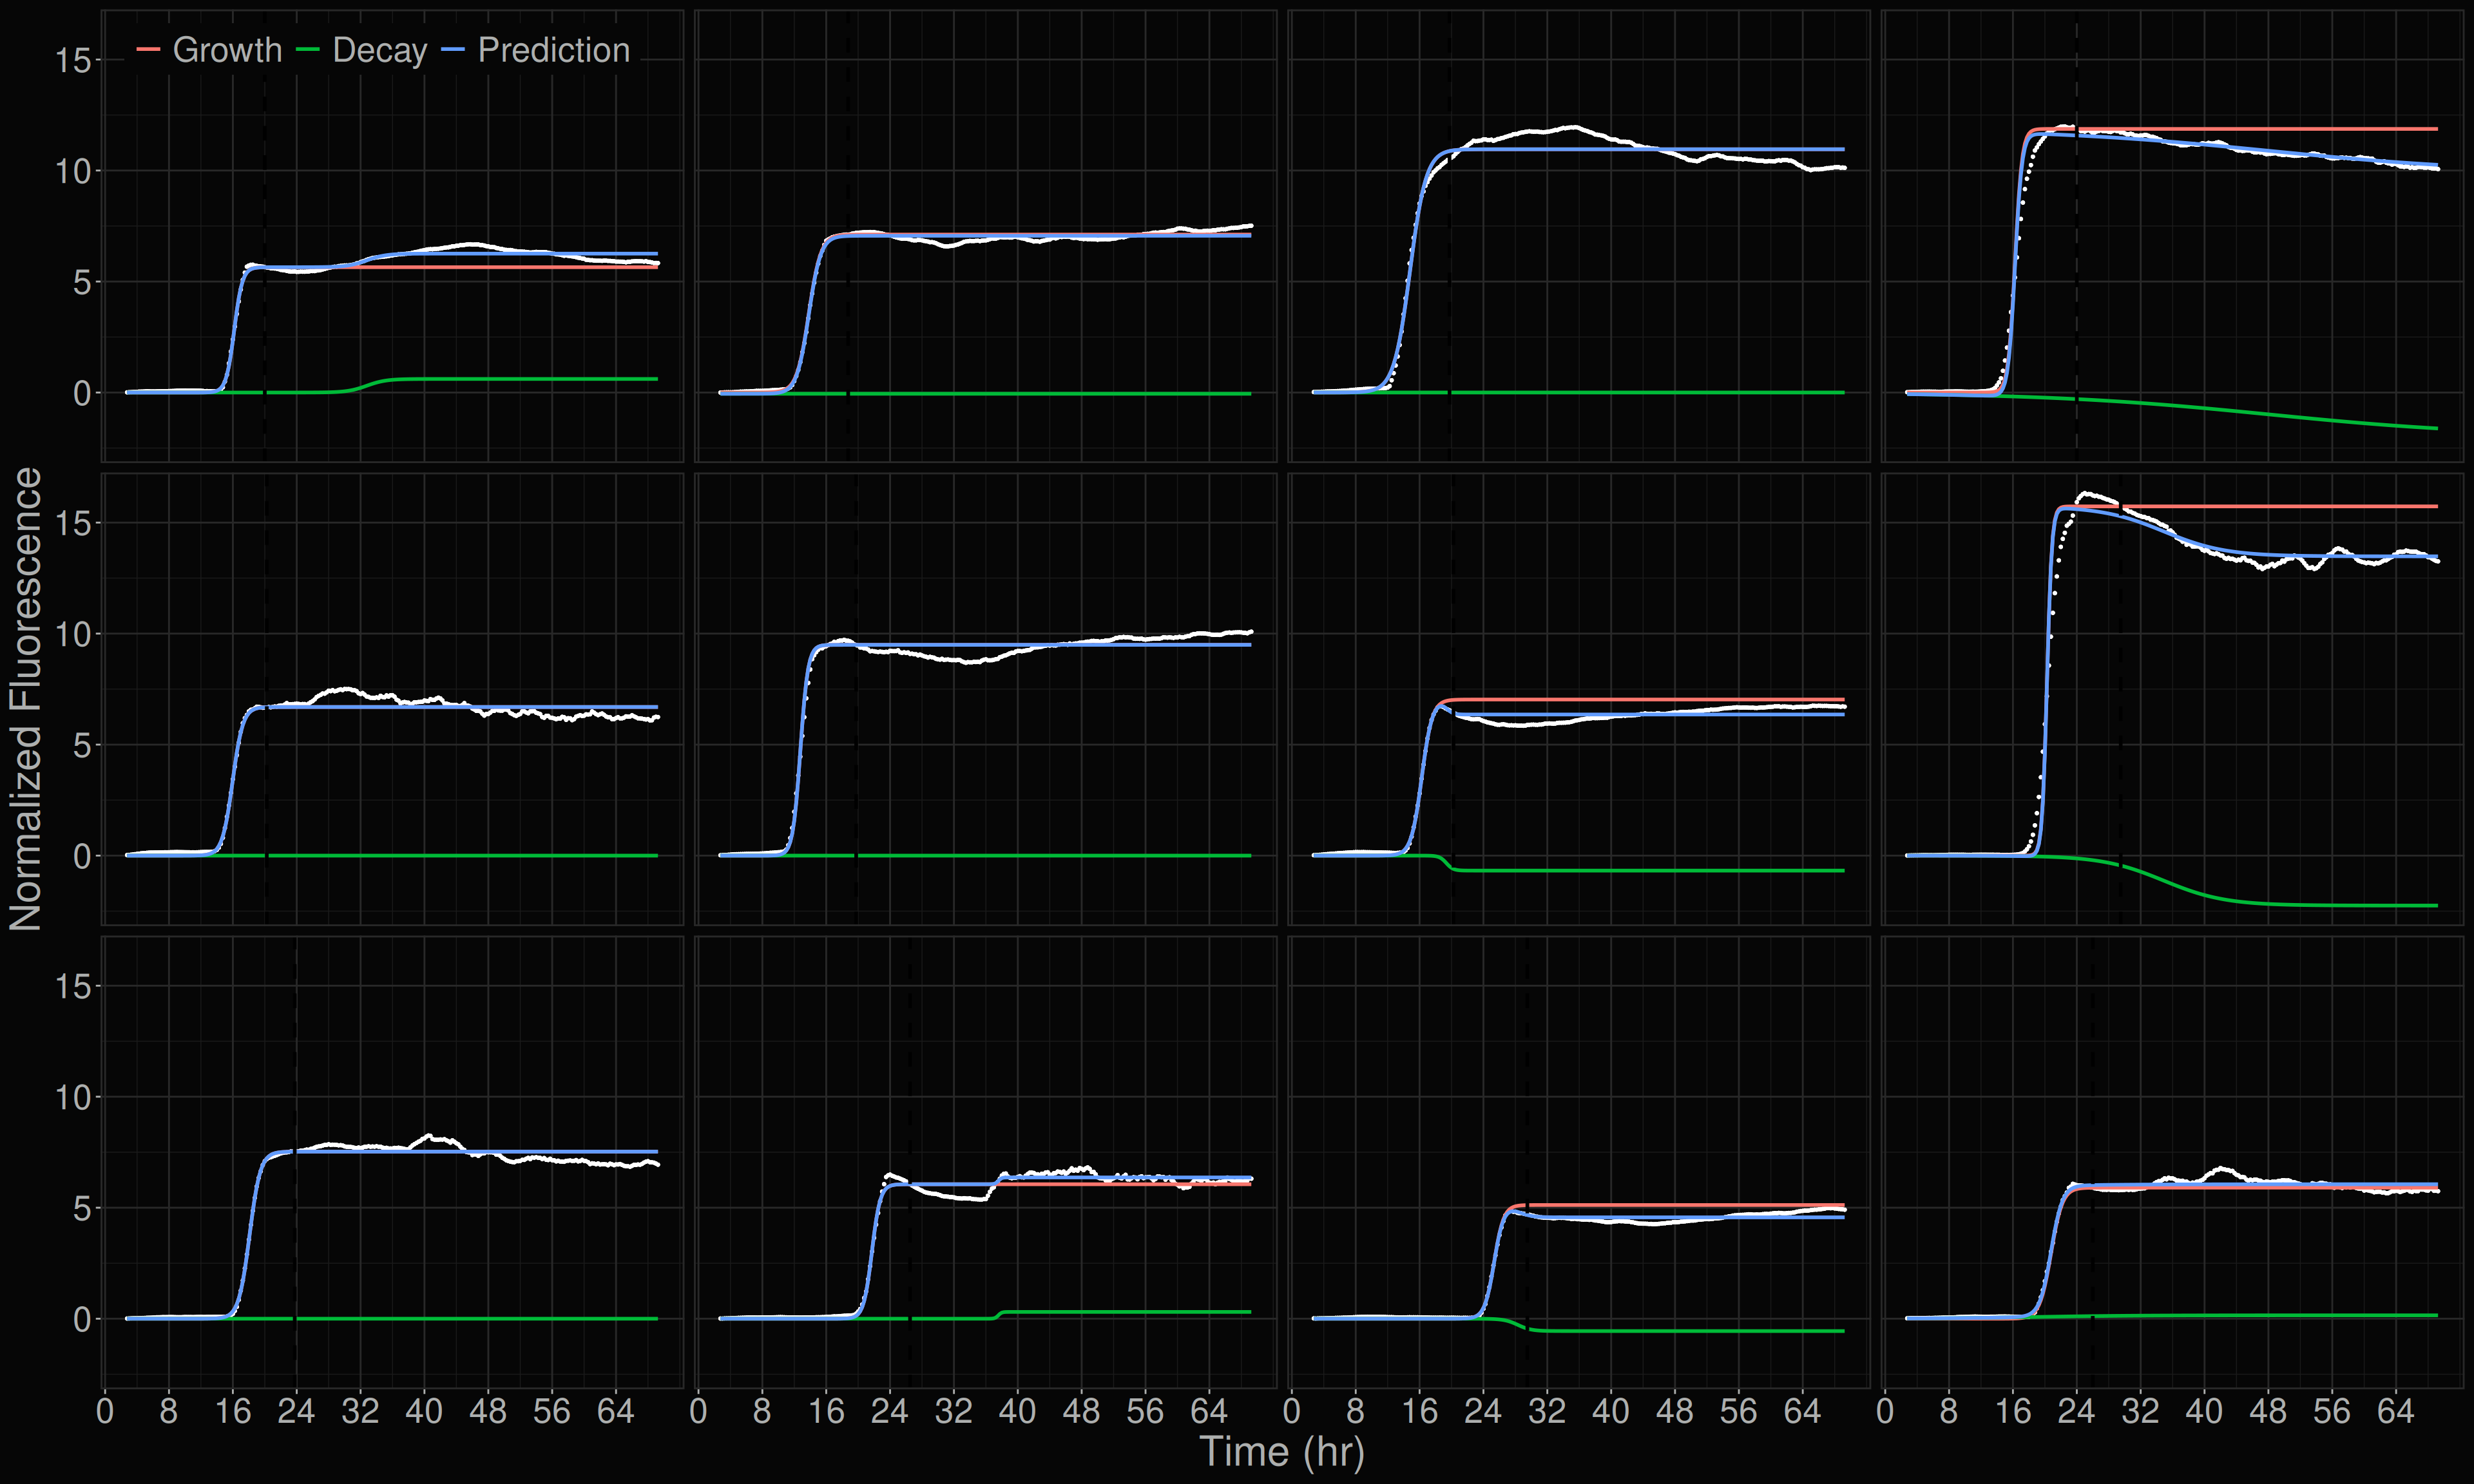
These fits represent the 12 worst fits based on the pseudo-R\(^2\) metric. They aren’t necessarily bad fits, but are those that least resemble the emperical data.
Best fits
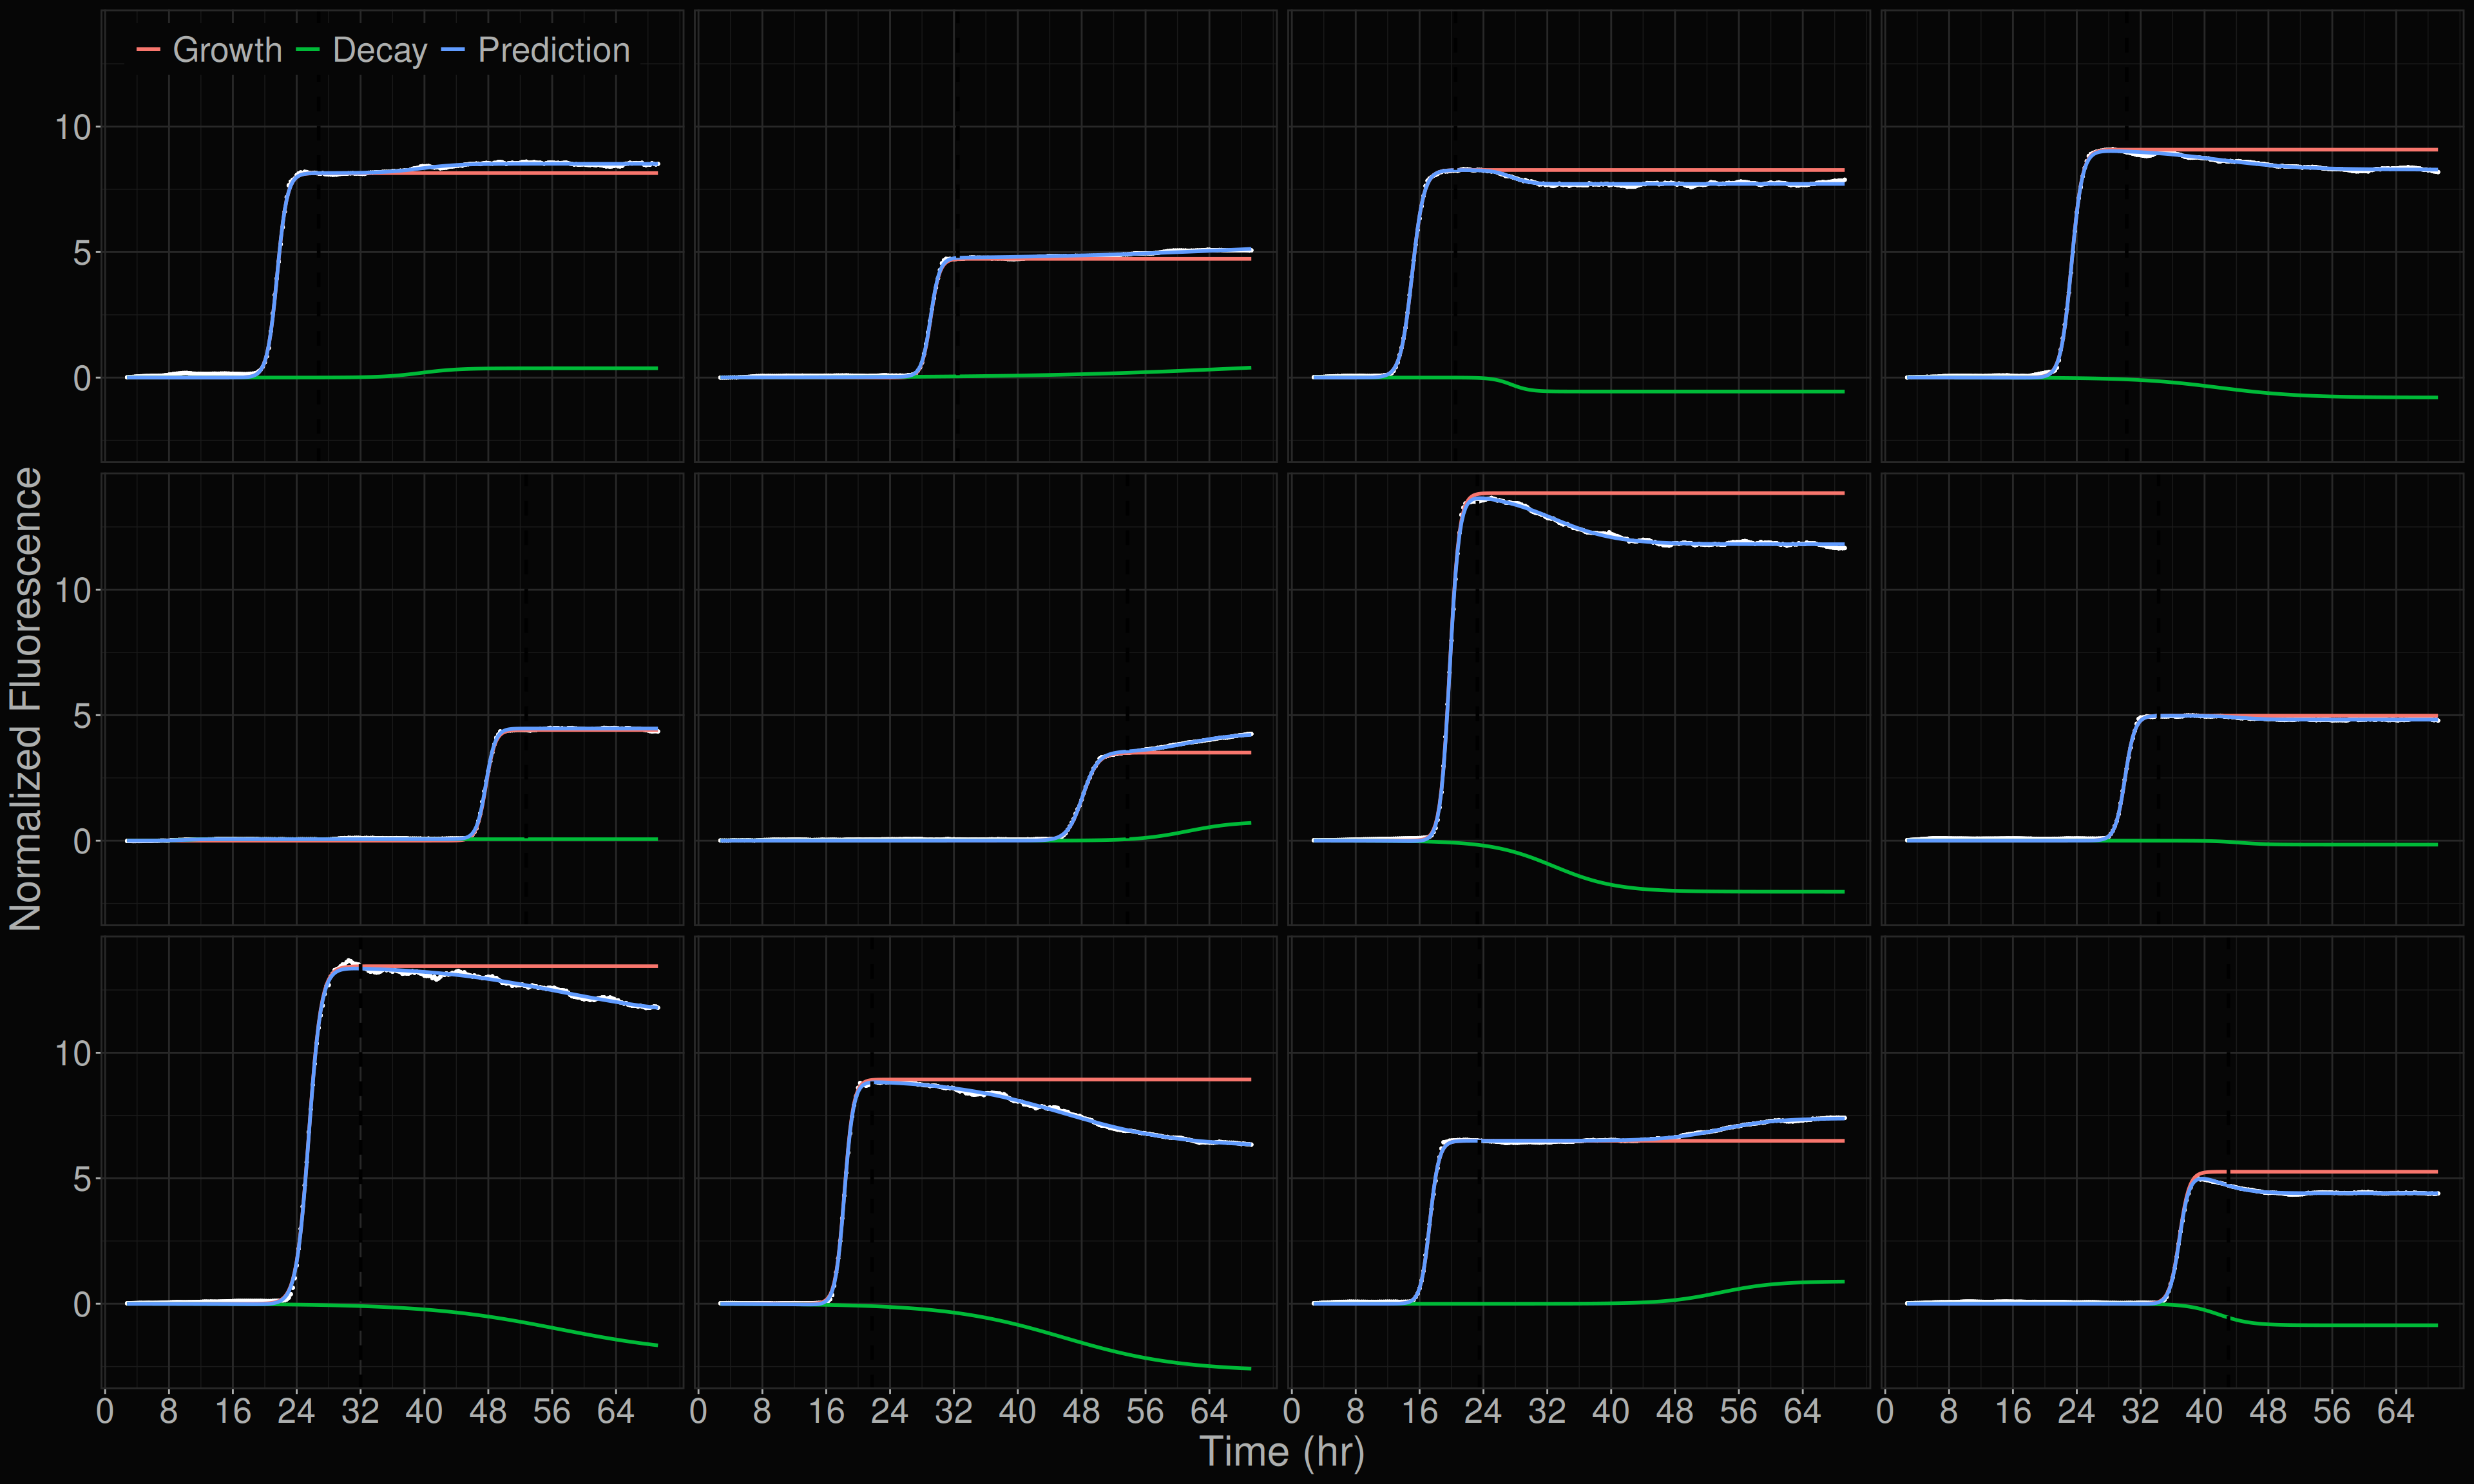
These fits represent the 12 best fits based on the pseudo-R\(^2\) metric.
Effect of seed dilution on model coefficients
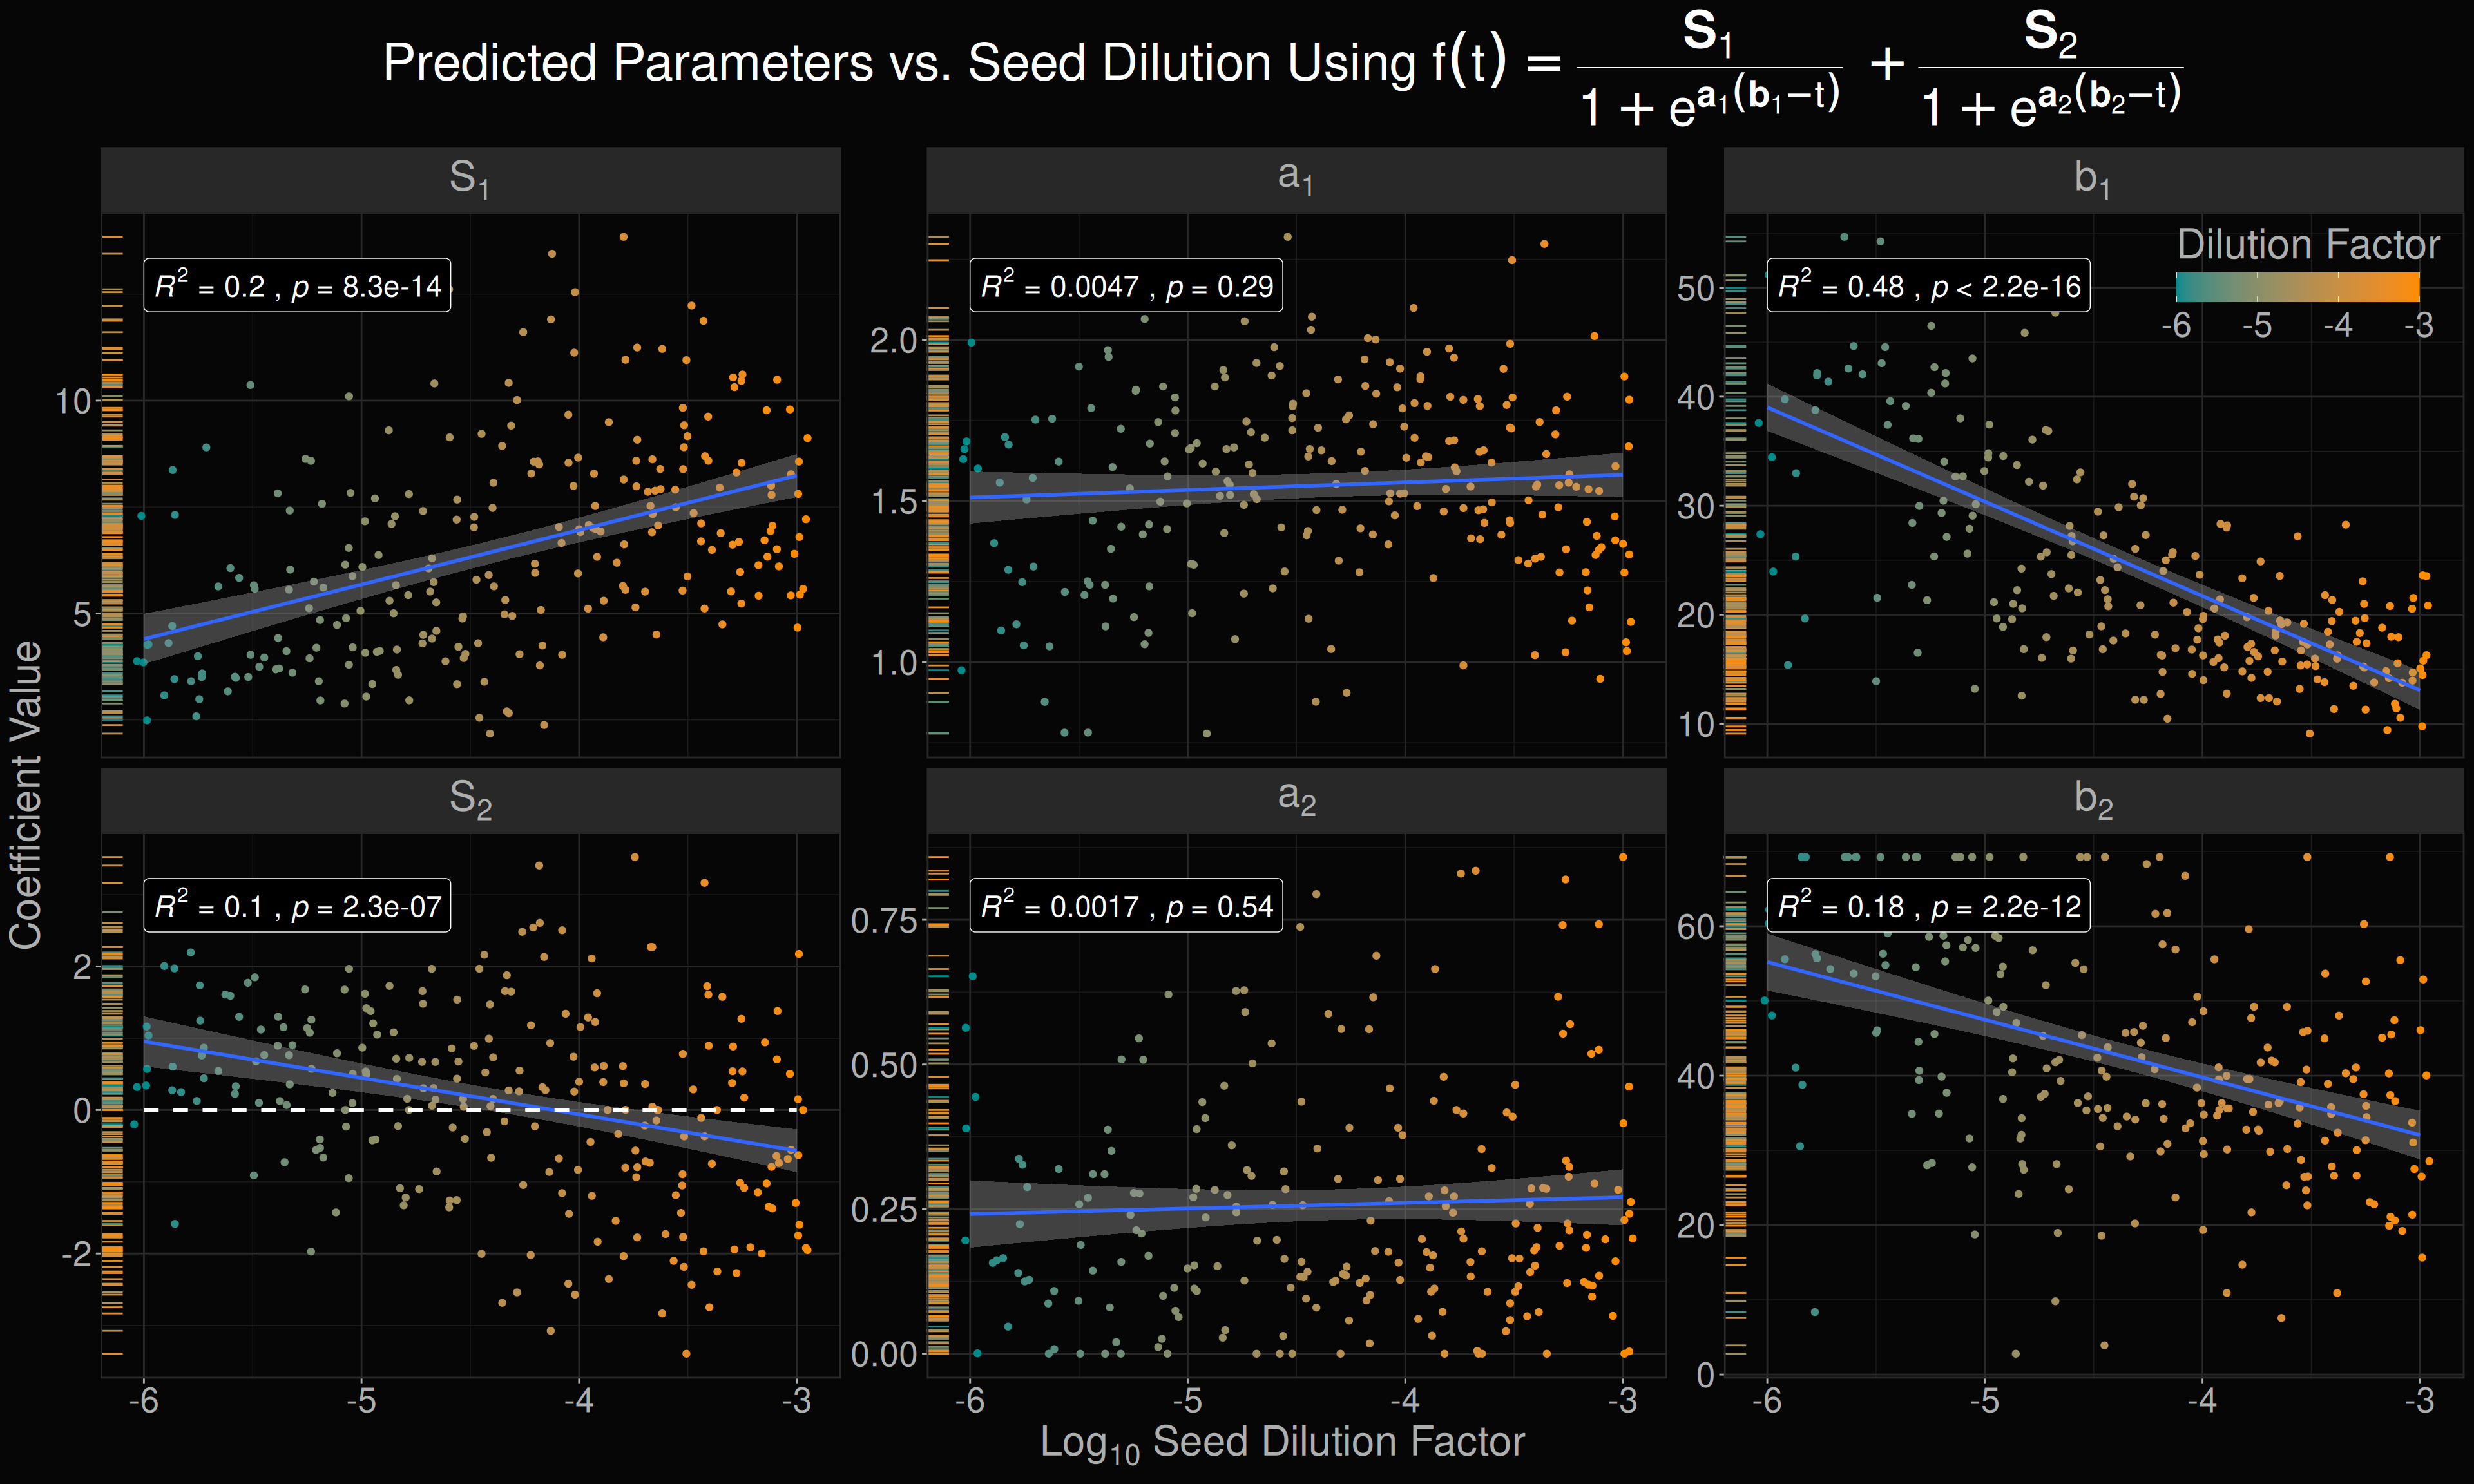
I plotted the parameters as a function of initial seed concentration. The initial seed concentration really has an effect on \(b_1\) (basically t\(_\text{lag}\)) which is expected, and to some extent S1 (~ maximum fluorescence). Interestingly, S2 becomes more negative as the seed concentration increases (i.e. more seed = more dampening effect). Also interestingly, there seems to be no effect on either a1 or a2 (i.e. the steepness of the inflection point).